*Geek Box: Pooled Analysis
You’ll have come across meta-analysis over and over in reading research, but a pooled analysis is same-same-but-different. Both meta and pooled analysis are similar insofar as they are condensing multiple published studies into an overall analysis, to obtain a summary of the effect of an exposure on an outcome of interest.
In a meta-analysis, the results of each primary study are included, and the analysis is conducted by combining all these results together to obtain a single summary estimate of the overall effect. This is an attractive methodology where the primary included studies are relatively similar in design, and where the exposure is similar in dose, two criteria that are more easily met in medical interventions.
A pooled analysis is another method of summarising results, but rather than use the overall result of the primary study, use the individual data from the participants in that study, and combine – ‘pool’ – all this individual data together. This provides increased statistical power, and allows for testing different aspects of the relationship between an exposure and outcome by doing sensitivity analysis [i.e., testing a specific variable within an overall analysis on the outcome], performing sub-group analysis [i.e., studies with >10yrs follow-up or studies with men and women separately], and investigating dose-responses.
Pooling itself if all individual data is just all lumped together can yield spurious results. Thus, just like meta-analysis, real care must be taken in the methodology, and the studies included must have clear inclusion/exclusion criteria, similar laboratory analysis methods for the primary data and biomarkers measured, and the data must be standardised for analysis. If these criteria can be met, then pooling individual data together can, in effect, act as one very large cohort [vs. combining individual study results, where smaller studies may be considered less reliable].
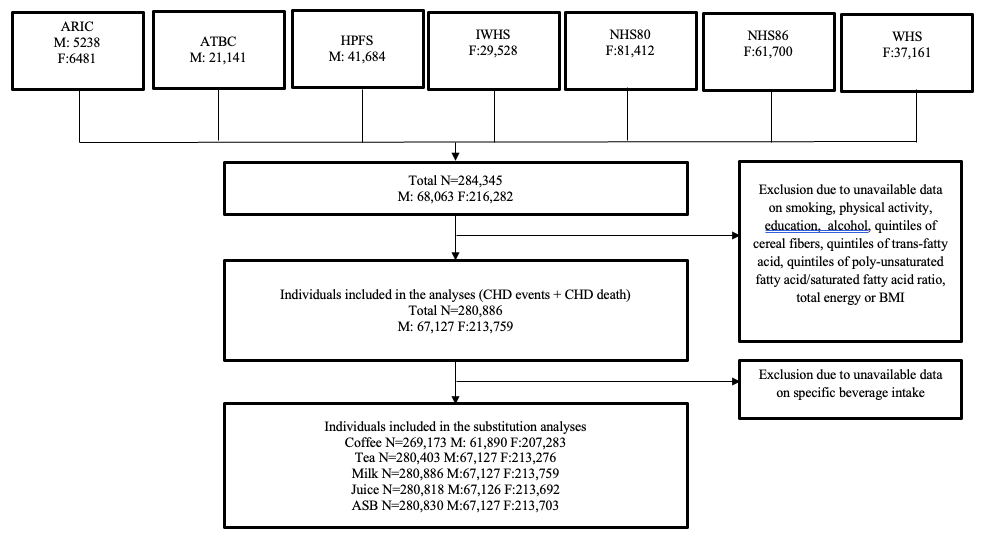
The flow chart below from the present study provides a good visual representation of this pooling process, with each of the 6 included studies being combined into an individual-data pooled analysis with nearly 290,000 participants – a huge sample size.