Riley TM, Sapp PA, Kris-Etherton PM, Petersen KS. Effects of saturated fatty acid consumption on lipoprotein (a): a systematic review and meta-analysis of randomized controlled trials. Am J Clin Nutr. 2024 Jul 2:S0002-9165(24)00591-4.
Listen to Audio (~15mins)
Audio available for subscribers[audio mp3="https://www.alineanutrition.com/wp-content/uploads/2024/08/SFA-Lpa.mp3"][/audio]
What We Know, Think We Know, or Are Starting to Know
From the discovery of the LDL-receptor by Goldstein and Brown, and the quantum leap in our understanding of cholesterol metabolism that won them a Nobel Prize in 1985 (1), it would be another three decades before LDL-cholesterol was determined to be causal in atherosclerosis and cardiovascular disease [CVD] (2).
However, that LDL-C is causal of CVD does not preclude other risk factors from being determined as causal, given that several risk factors may influence complex disease processes. For example, hypertension is also a causal risk factor for stroke and CVD (3), which is not inconsistent with LDL causality given their respective pathways and mechanisms of action.
Yet this principle also extends to other lipoproteins in the causal pathway for atherosclerosis and CVD, for which sufficient evidence has accumulated to determine that lipoprotein(a), known as Lp(a), now joins LDL-C as a causal risk factor for CVD (4). Lp(a) is linearly associated with CVD risk even with low LDL-C levels (4).
The rather nasty characteristic of Lp(a), however, is that levels of Lp(a) in the circulation are primarily determined by genetics (4). However, several non-genetic factors have been shown to influence Lp(a) levels, including ethnicity and cardio-metabolic health status (4).
Diet has also been suggested to have some influence on Lp(a), but given what we know about diet and CVD risk, one dietary variable is certainly surprising: increasing saturated fat over both unsaturated fats and carbohydrates appears to lower Lp(a) (5,6).
So, how reliable is this effect and how might it influence our thinking on CVD risk management?
The Study
The study was a systematic review and meta-analysis of the effects of saturated fats [SFA] on Lp(a) conducted according to the following inclusion criteria:
- Design: Randomised controlled trials [RCTs].
- Population: Healthy adults aged between 20 to 65 years.
- Intervention: Diets low in SFA and proportionally higher in either carbohydrates, monounsaturated fats [MUFA], polyunsaturated fats [PUFA], or trans fats [TFA].
- Comparator/Control: Isocaloric diets higher in SFA compared to the intervention diet.
- Outcomes: Lp(a) levels post-intervention.
- Duration: A minimum of 13 days.
Subgroup analyses were conducted according to the primary nutrient replacing SFA in the intervention diets. A meta-regression analysis was also conducted to determine sources of variation in study outcomes, including factors such as whether a study had fully controlled diets, the percentage differences in SFA between diets, and the duration of the study.
The outcomes were reported as standardised mean differences [SMD], i.e., as an effect size measure with 0.2, 0.5, and 0.8 denoting small, moderate, and large effect sizes, respectively. 95% confidence intervals [CI] were reported with the SMD.
Results: The final analysis included 27 RCTs with a total of
n = 1,325 participants. The average level of SFA in the low-SFA intervention diets was 8.7% compared to 16.4% in the high-SFA comparator diets. The average baseline Lp(a) level was 14.3mg/dL.
Main Analysis – Effects of Lower vs. Higher SFA on Lp(a): Compared to diets higher in SFA, lower SFA diets increased Lp(a) levels with an effect size of 0.14 [95% CI, 0.03 to 0.24].
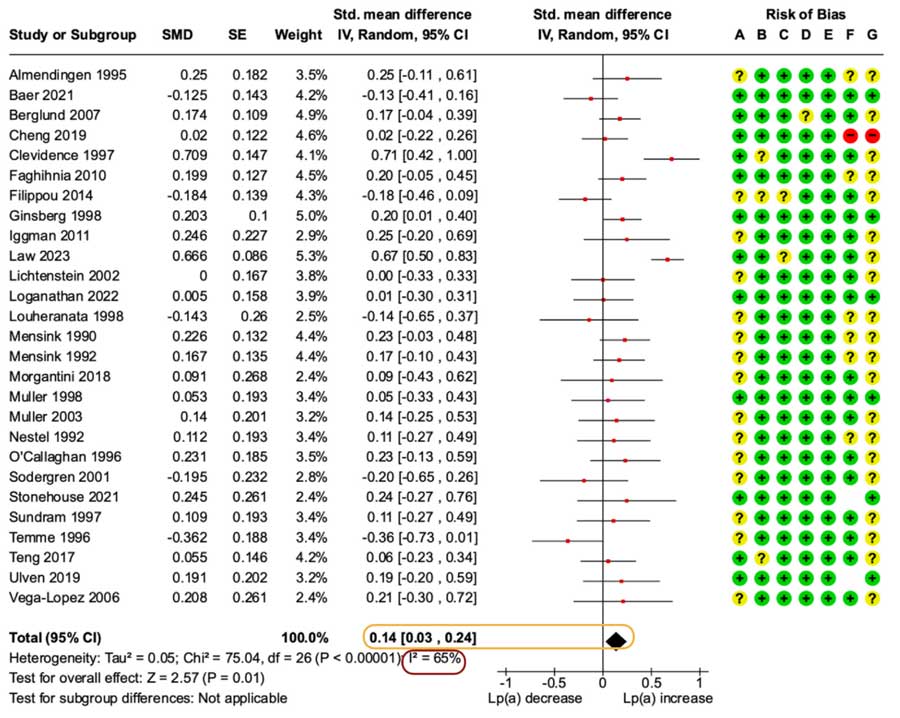
Forest plot from the paper illustrating the main analysis comparing lower to higher SFA diets. The effect estimate is encapsulated in orange, note that an SMD of 0.14 is a negligible effect size, and the entire range of the 95% CI is under a small effect size. There was also moderate-high heterogeneity that is evident in the I2 percentage encapsulated in red.
Subgroup Analysis – Effects of Substitution of SFA on Lp(a): Replacing SFA with carbohydrates led to greater increases in Lp(a) than higher SFA diets, with a small effect size of 0.21 [95% CI, 0.02 to 0.40].
Replacing SFA with TFA also led to greater Lp(a) increases compared to higher SFA diets with a small effect size of 0.32 [95% CI, 0.17 to 0.48].
Conversely, replacing SFA with either MUFA or PUFA did not result in significant differences in Lp(a) levels between lower and higher SFA diets.
Meta-Regression Analysis – Effects of Individual Predictors on Lp(a): The differences in Lp(a) levels showed no association with the percentage difference in SFA intake between diets, the duration of the study, the number of diet periods, or the year of publication of the study. Of note, the changes in Lp(a) were independent of differences in LDL-C and HDL-C between diet groups.
The Critical Breakdown
Pros: The aims of the study were clearly stated, and the review protocol and inclusion criteria were pre-registered with the PROSPERO database of systematic reviews. The published paper is consistent with the pre-registered protocol. The inclusion criteria were thorough and included specific consideration of substitution effects for the nutrient that replaced SFA in the lower SFA intervention diets. The literature search was thorough, including reference lists of previously published reviews. The results were clearly presented and several informative subgroup analyses, including for the replacement nutrient and for baseline Lp(a) levels [see
Interesting Finding, below], were conducted. 21 of the 27 included RCTs were fully controlled feeding trials, which bolsters the robustness of the analysis, in particular the substitution analyses. Only one included trial was graded as high risk of bias.
Cons: Almost all analyses showed moderate to high heterogeneity, which suggests that the effect estimates vary from the true population effect of SFA on Lp(a) levels. The heterogeneity may have resulted from different measurement methods for Lp(a) in the primary included studies and the authors do state that many of the included studies did not report on whether data for Lp(a) was presented as transformed data [to achieve a normal distribution for statistical analysis] or untransformed raw data. The overall sample size of 1,325 participants should, given the heterogeneity in the analyses, serve to temper overextrapolation of the findings, particularly given that neither sex nor ethnicity differences were considered in the analysis. Finally, the average Lp(a) levels in the overall cohort were low and well under risk thresholds [see
Key Characteristic, below].
Key Characteristic
A notable characteristic of the evidence for dietary influences on Lp(a) is that differences are observed independent of changes in LDL-C levels, which the present study corroborated. Thus, the effects of substituting SFA for other nutrients on Lp(a) warrant consideration separate from the potential influence of such substitutions on LDL-C levels.
However, it is crucial to scrutinise levels of Lp(a) relative to the thresholds at which risk is observed, which is >50mg/dL [and the range of 30–50mg/dL considered the “grey zone” where risk is assessed relative to other risk factors] (4). This is important in the context of some of the positive findings of the present study.
Consider the substitution analysis showing that replacing SFA with carbohydrates increased Lp(a) levels relative to higher SFA diets; in the
forest plot, below, you can see that the largest effect size was derived from a study by Law
et al., 2023.
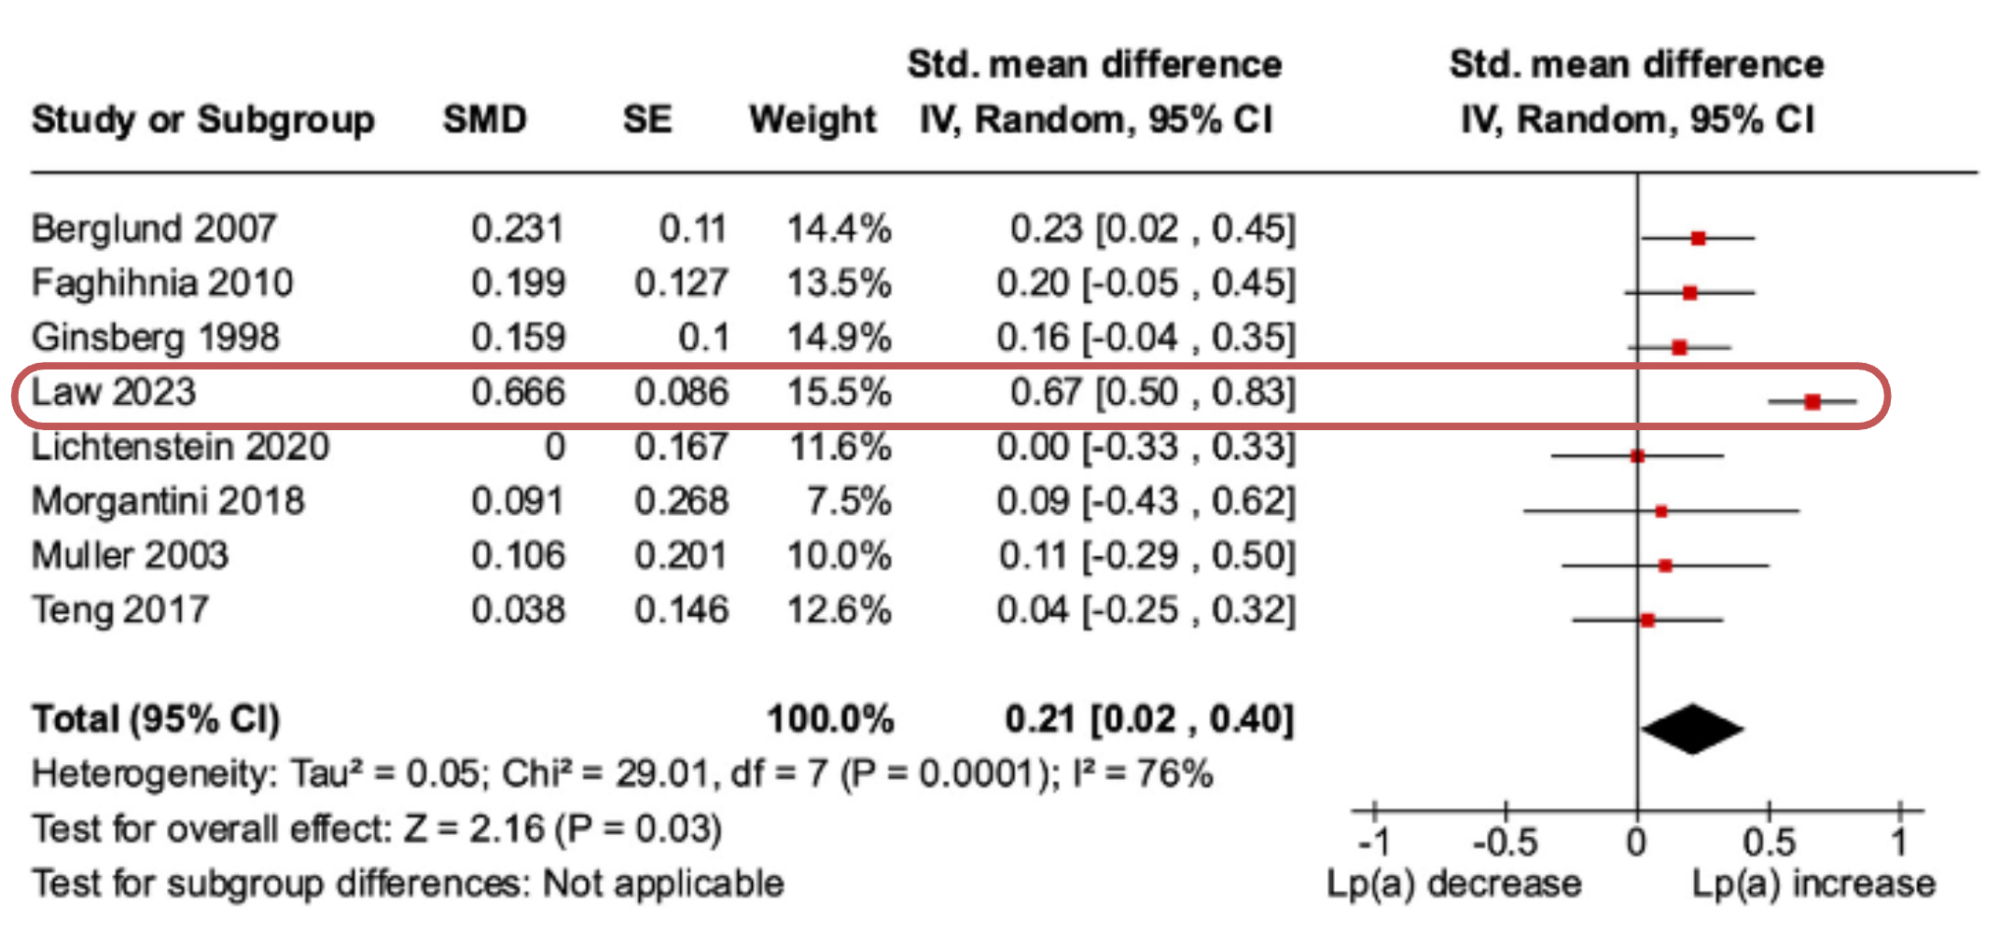
However, if we look at that study, it is evident that the largest increase in Lp(a) was observed in participants with Lp(a) levels >50mg/dL who had a two-fold greater increase in Lp(a) compared to participants <50mg/dL (7). And in sensitivity analysis, the removal of the Law
et al. study attenuated the effect size to 0.14, which is negligible.
This suggests that absolute levels of Lp(a) are important to interpreting changes related to diet, which leads us to the next section…
Interesting Finding
The interesting finding of the present study resulted from a subgroup analysis that stratified trials as above or below the average baseline Lp(a) level of participants in the included trials, which was 14.5mg/dL.
A significant effect of lower SFA diets increasing Lp(a) was only observed in trials with an average baseline Lp(a) of >14.5mg/dL, a small effect size of 0.17 [95% CI, 0.02 to 0.33]. However, if we look at the
forest plot, below, again we can see that most studies have noisy non-significant effect estimates, while two have contributed moderate–large effect sizes to the analysis.
One of which is the Law
et al. (7) trial we have previously mentioned, but an additional detail is that their trial was conducted in Black–American participants, and Black ethnicity exhibits the most variation in Lp(a) and the highest average concentrations of Lp(a), compared to other ethnic groups (4).
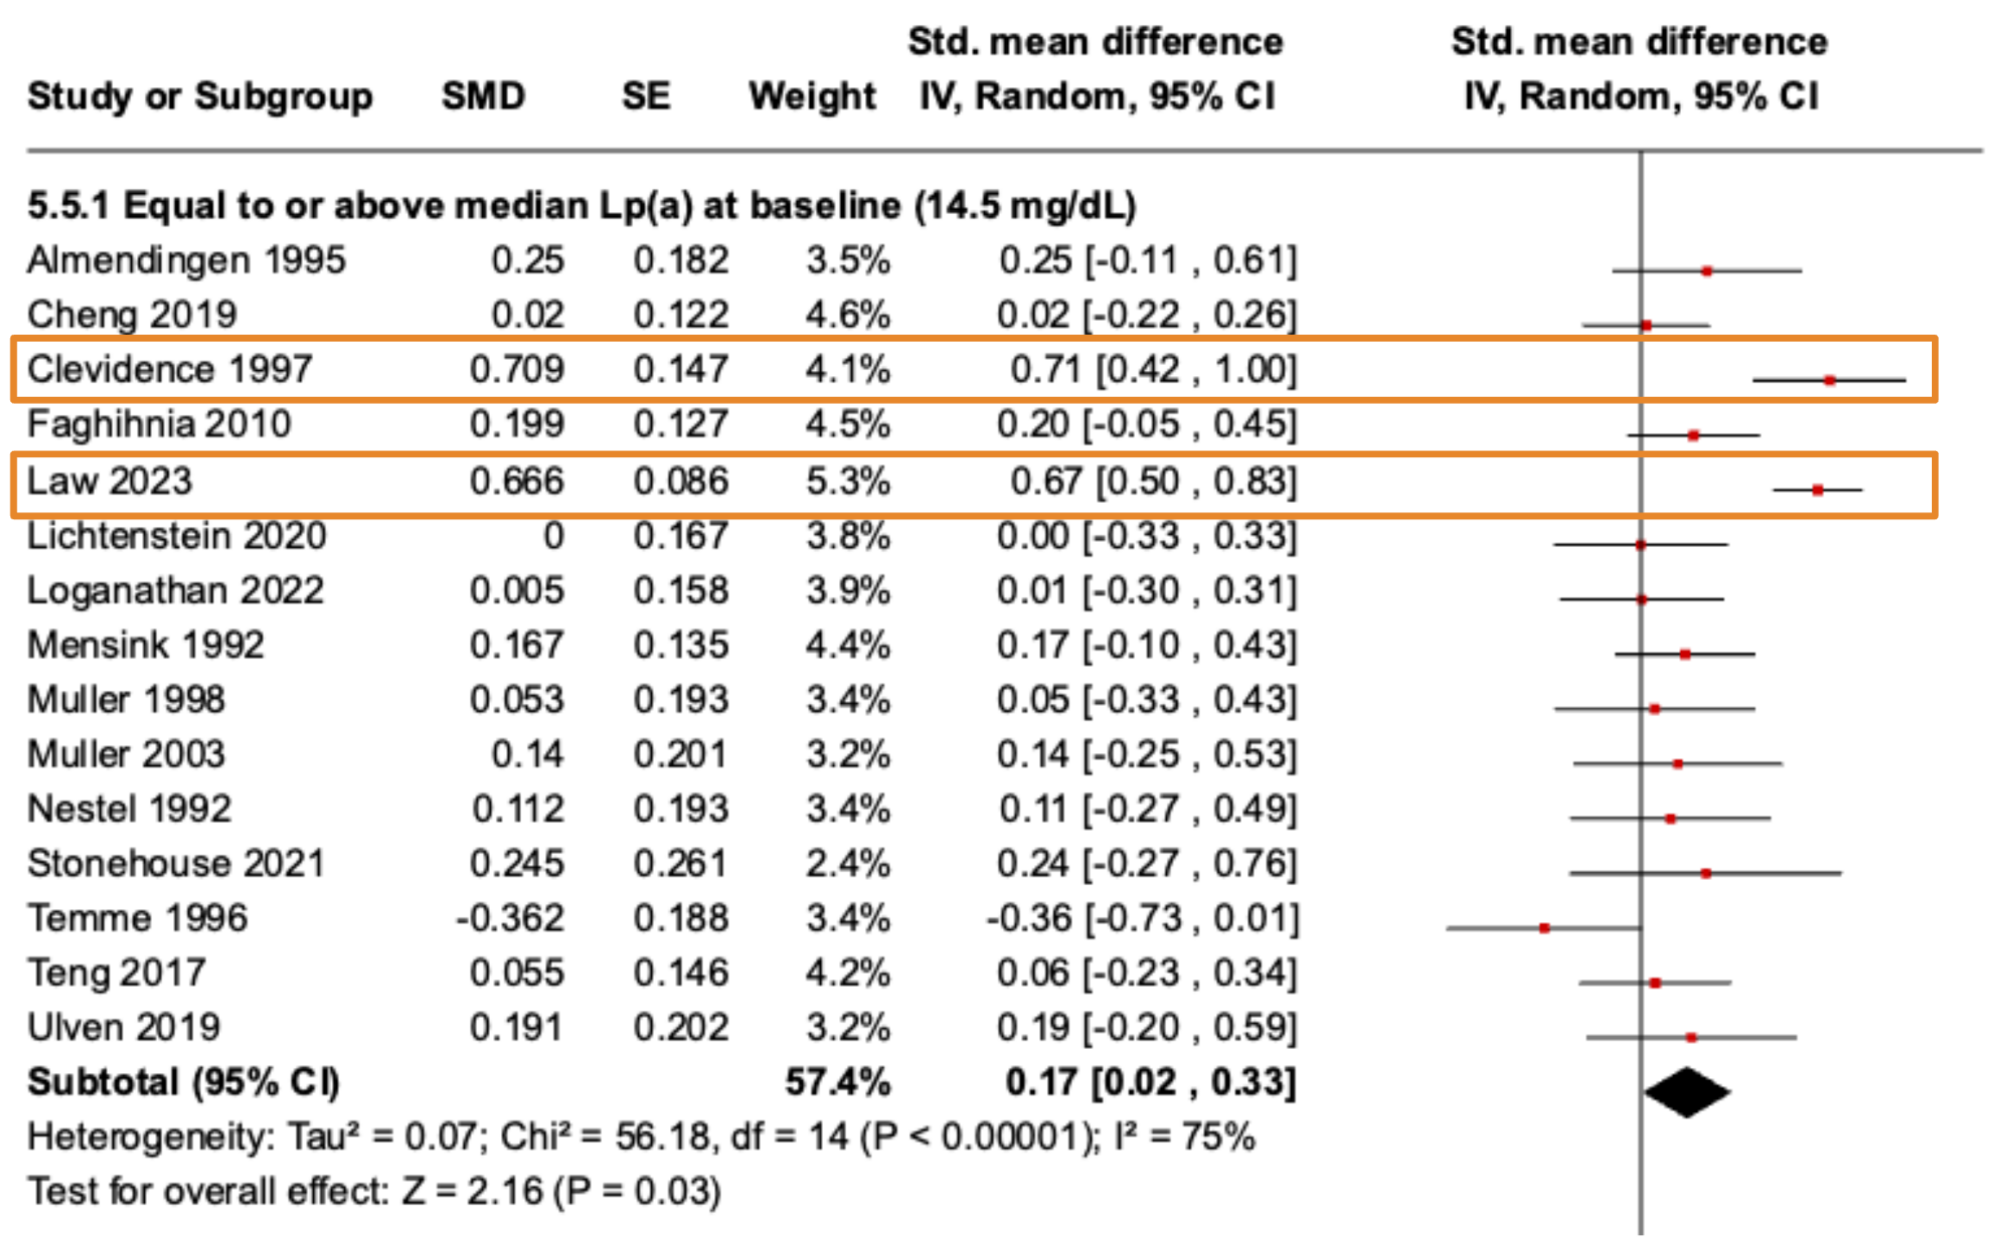
In the other study, Clevidence
et al., 1997 (8), the higher SFA diets resulted in lower Lp(a) levels relative to MUFA in participants with Lp(a) levels of ≥50mg/dL, but the magnitude of the difference was small, i.e., an average achieved Lp(a) level of 50mg/dL on the SFA diet compared to 53.2mg/dL on the MUFA diet.
In participants with Lp(a) levels <30mg/dL, the Lp(a) levels between the higher SFA vs. higher MUFA diets were 12.6mg/dL and 15.2mg/dL, respectively. Thus, the small differences below the risk threshold might be “statistically significant” but amount largely to physiological noise.
Relevance
It is important to note that most trials have not directly tested macronutrient effects on Lp(a) as a primary outcome in, for example, individuals with high Lp(a), to determine relevant effects of macronutrient composition on this risk factor.
The context that we must bear in mind is that Lp(a) levels are primarily genetically determined, with up to 90% of the variability in Lp(a) levels explained by genetics (4). The impact of diet is thus primarily observed superimposed on Lp(a) levels that are genetically determined into a risk range >50mg/dL, or in the so-called grey area of 30–50mg/dL.
In the overall meta-analysis of the present study, the removal of the Law
et al. and Clevidence
et al. papers attenuated the effect size from 0.14 to 0.11, respectively, taking an already negligible effect size into further irrelevance. This point is important; all findings in the present study were either negligible to small effect sizes that are difficult to justify much attention to.
Yet both studies are instructive; the Law
et al. paper in Black participants with Lp(a) levels either >30mg/dL or >50mg/dL at baseline, in whom the effect of lowering SFA was strongest in those already over the >50mg/dL risk threshold (7). In the Clevidence
et al. paper, most participants were well <30mg/dL and the absolute magnitude of difference between diets was small.
All of this is to say that the suggestion that
higher SFA leads to
lower Lp(a) is primarily observed within ranges of up to 30mg/dL that are not associated with risk in the first instance. And there is no evidence that
increasing SFA will
lower Lp(a) out of risk thresholds of >30mg/dL or >50mg/dL. Be careful with how this data is interpreted.
Application to Practice
Lp(a) is a causal risk factor for CVD, but unlike LDL-C, is not as responsive to dietary manipulations. The “
saturated fats lower Lp(a)” narrative reflects a red herring in this research that fails to consider the baseline levels of Lp(a) relative to current risk thresholds.
The abundant evidence for the LDL-C lowering effects of replacing SFA with MUFA/PUFA remains the mainstay dietary modification to lower CVD risk, and the noise in the diet and Lp(a) research should not distract from that.


