 Author Bio:
 Patrick Elliott is a PhD student in Human Nutrition from University College Dublin, where his research focuses on the development of personalised nutrition interventions to promote sustainable and healthy eating in university students. Patrick holds a master's degree in Public Health (Nutrition) from University College Dublin and a bachelor's degree in Sport Science and Health from Dublin City University. Patrick also works as Health and Nutrition Science Communication Officer for Training121, where he frequently writes blog articles on a range of health- and nutrition-related topics. When not researching or writing, Patrick loves to get outdoors, run, and watch live music (particularly punk and other forms of rock).
Social Links: LinkedIn ; Instagram
Behaviour change is considered to be a complex, difficult problem (1, 2). Individuals with an alcohol problem, a gambling addiction, or a poor diet, may consistently fail to change their behaviour for the better. Yet, many individuals have made—and successfully maintained—substantial changes in their behaviour; an extreme example of which is the heralded social media stereotype of the inactive individual living with obesity who becomes an Ironman triathlete. However, we also recognise that this is the exception to the rule; global adult obesity rates have more than doubled in the last 35 years, after all (3).
Nevertheless, it raises the question of whether the circumstances that lead to successful behaviour change for a given individual [and behaviour] are externally valid. In other words, if a different individual happened to find themselves in the right scenario with the right conditions to successfully enact [and maintain] behaviour change—whatever that scenario, those conditions, and that behaviour may be—would it occur? And if so, as nutritionists and public health practitioners, is it possible to get people to this point if our goal is to help them change their dietary behaviours?
For the purposes of this article, I borrow a multidisciplinary consensus definition of behaviour, defined as:
"Anything a person does in response to internal or external events. Actions may be overt (motor or verbal) and directly measurable, or covert (e.g. physiological responses) and only indirectly measurable; behaviours are physical events that occur in the body and are controlled by the brain.’" (4)
A Unifying Theory of Human Behaviour
It is this optimal scenario, where individuals have all that is necessary to enact a given behaviour, that is so well conceptualised in the COM-B [Capability, Opportunity, Motivation Behaviour] model of human behaviour (5). In brief, the COM-B model [
Figure 1] is an integrative model of human behaviour that illustrates that behaviour will occur when an individual has the
capability [physical and psychological],
opportunity [physical and social], and
motivation [automatic or reflective] to engage in said behaviour (5). If any of these components are not present, the behaviour will not occur (5). Therefore, in an optimal behaviour change scenario, an individual has the necessary capability, opportunity, and motivation to engage in the specific behaviour in question.
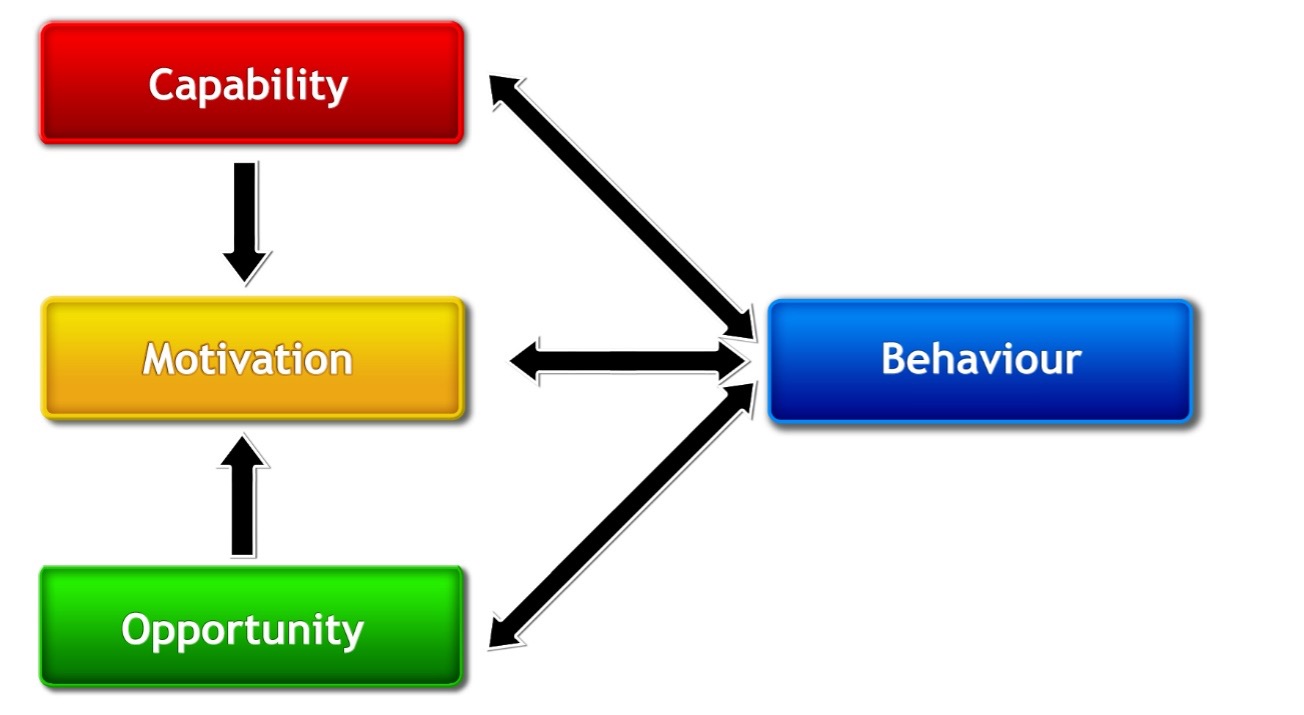
Figure 1. The COM-B model (5). Capability is broken down into physical or psychological capability; opportunity into physical and social opportunity; and motivation into automatic or reflective motivation. Capability and opportunity change behaviour primarily through improving motivation, and performing a behaviour can improve each component of behaviour in a positive feedback loop. Domains within the Theoretical Domains Framework, which is a framework for identifying determinants of behaviour, can be mapped onto COM-B model components to offer further granularity regarding specific domains of behaviour that feature within COM-B model components (e.g., ‘knowledge’ sits within psychological capability, whereas ‘goals’ and ‘intentions’ sit within reflective motivation) (6).
The COM-B model is a simple, unifying model of human behaviour that departs from more narrow, discipline-specific models [e.g., the Theory of Planned Behaviour] while incorporating their mechanisms of action [MOA], i.e., how they work to change behaviour (5). To give an example, the Theory of Planned Behaviour purports that human behaviour is goal-directed, and an individual’s attitudes, subjective norms, and perceived behavioural control influences their intentions to enact a behaviour which, in turn, leads to behaviour change (7). Under the COM-B model, these MOA can be thought of as impacting multiple components of behaviour:
- Capability: An individual’s perceived behavioural control regarding enacting a behaviour may be influenced by their physical and psychological skills (or capability).
- Opportunity: An individual’s subjective norms are influenced by social, group, and/or societal norms, which links to the social opportunity aspect of the COM-B model.
- Motivation: Positive and negative attitudes or beliefs will affect an individual’s motivation to engage in a behaviour, as will their perceived behavioural control. Forming intentions to engage in a behaviour also impacts motivation to engage in that behaviour.
But what if an individual has the requisite attitude(s), subjective norms, and perceived behavioural control to form intentions to complete a behaviour, but they still do not perform it? This is where the COM-B model can offer further benefit beyond more narrow theories of behaviour such as the Theory of Planned Behaviour. Perhaps the individual lacks the physical opportunity to do so [e.g., lack of money or time], or perhaps they have an unconscious drive to not engage in this behaviour [e.g., an unconscious compulsion to eat when they consciously do not want to, which indicates automatic motivation as the behavioural component needing to be addressed]. Aided by the COM-B model [and the Theoretical Domains Framework, if necessary (6)], we can etch closer to understanding what component(s) of behaviour need to be addressed to achieve an optimal scenario for behaviour change. Because there may be inter-individual differences regarding components of behaviour that act as barriers to improving dietary behaviours, personalised nutrition (PN) interventions that are sensitive to this could help deliver an optimal scenario for dietary behaviour change for various individuals.
Major Assumptions in Personalised Nutrition
Population-level approaches to public health are underpinned by the notion that shifting the entire distribution of risk factors in a population to lower risk categories benefits more people than just employing a high-risk approach (i.e., shifting only high-risk individuals into lower risk categories) (8). However, the "Prevention Paradox" dictates that such a population-level approach offers little benefit to the individual, despite offering considerable benefit to the population at large (9). This fact lends support to personalised approaches to public health promotion, such as "personalised nutrition" [PN] interventions, as an adjunct to population-wide approaches.
Traditional conceptions of PN have centred differences in biological traits as input variables to generate PN advice (10). The first assumption is that, because no two individuals are the same, "1-size-fits-all" dietary advice is insufficient to achieve optimal diet-related health (10). Therefore, PN advice has been proposed as an approach to optimise disease management and/or health, and often through the integration of fields such as genomics, epigenetics, systems biology, medicine, and behavioural science (10-12). A second assumption often underpinning PN advice is that, because PN advice is designed to be more appropriate to the individual, it will improve an individual’s adherence to dietary recommendations (10, 13). Taken together, PN interventions claim to:
- Produce unique dietary recommendations optimised to an individual’s biological context; and
- Enhance an individual's adherence to such personalised dietary recommendations [Figure 2].
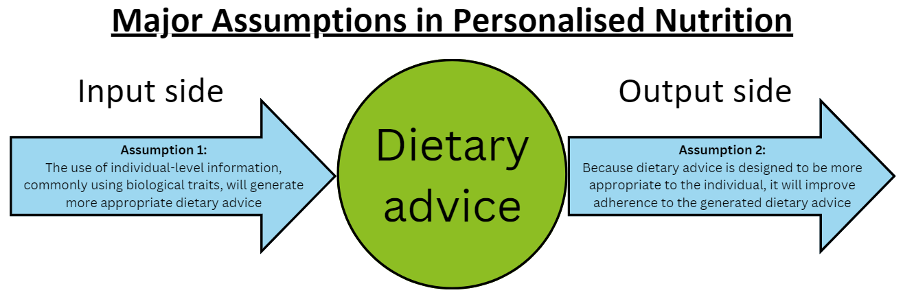
Figure 2. Major assumptions in personalised nutrition. Assumption 1 [the input side] states that the use of individual-level information [e.g., genotypic data, metabolic data, microbiome data, etc.] will generate more appropriate [i.e., personalised] dietary advice relative to generic, population-level dietary advice. Assumption 2 [the output side] states that because this personalised dietary advice is more appropriate for the individual, it will therefore improve adherence to the dietary advice relative to a scenario where people are given generic, population-level dietary advice instead.
Personalised Nutrition: The Evidence to Date
The largest PN intervention to date is the pan-European, web-based Food4Me randomised controlled trial (13). This trial tested the proposition that PN advice delivered via decision tree algorithms would "
promote larger, more appropriate, and sustained changes in dietary behaviour" relative to generic dietary guideline-based advice (13). After 6 months, PN advice led to significantly greater reductions in red meat, salt, and saturated fat intakes, and greater increases in folate intakes, Healthy Eating Index scores, and Mediterranean diet adherence relative to the control group (13, 14). In addition, individuals receiving PN advice showed significant improvements in body weight and body mass index relative to the control group [at 3 months of follow-up only] (13).
However, Food4Me failed to find any difference in dietary behaviour and cardiometabolic health improvements between PN advice delivered based on dietary intake information alone compared with dietary intake plus phenotypic information [i.e., blood biomarkers] or dietary intake plus phenotypic plus genotypic information [i.e., diet-responsive genetic variants] after 6 months of follow-up (13). As a proof-of-principle study, Food4Me affirmed the assumption that PN advice will improve adherence to dietary recommendations relative to generic dietary guideline-based advice (13, 14). However, it highlighted that further dietary personalisation using phenotypic or genotypic data may not further improve outcomes and, while it showcased statistically significant improvements in dietary behaviours, these improvements were of questionable clinical significance.
Other large-scale PN trials have used individual-level physiological characteristics to generate more appropriate, personalised dietary advice (15-20). A discussion of the characteristics and results of these trials, as well some important takeaways from them, can be found in
Table 1. Overall, while there is some evidence that individual-level differences in physiological parameters can be used to generate more appropriate, personalised dietary advice, such differences have not been replicated across cohorts, and evidence that such advice improves dietary adherence is not always observed. This is especially true when studies balance behavioural support between intervention and control groups. More work is therefore needed to understand how to create more appropriate dietary advice [relevant to assumption 1] as well as how to improve adherence to PN advice (relevant to assumption 2). For the former, methods to address key evidence gaps have been voiced (21). For the latter, personalising interventions based on an individual’s behavioural context could be a promising approach.
Table 1. Summary of a number of high-profile, large-scale, personalised nutrition interventions
| Reference |
Study Description |
Population |
Study Length |
Outcomes |
Results |
Key Takeaways |
| Zeevi et al. (15) |
A machine learning algorithm was developed using participant data (i.e., blood samples, gut microbiome data, anthropometric data) to predict PPGR to foods. Then, a crossover RCT was conducted where one group received algorithm-based dietary advice to eat a 'good' or 'bad' diet (for PPGR) for a week each, compared to a group receiving dietitian-led dietary advice for the same. |
n=800 overweight individuals for phase 1 (creating algorithm); n=100 overweight individuals for validation of algorithm; n=26 for RCT. |
7 days each for phase 1 and validation cohort; RCT: 2 weeks (after profiling), where 1 week they ate a 'good' diet (i.e., predicted by algorithm to lower PPGR) and the second week they ate a 'bad' diet (i.e., predicted by algorithm to raise PPGR). The other group ate a 'good' diet predicted by a dietitian to lower PPGR, followed by a 'bad' diet predicted by a dietitian to raise PPGR. |
PPGR to standardised meals. |
High inter-individual variability in PPGR. Personal and microbiome features predicted PPGR. 10/12 participants in the algorithm-predicted arm of the RCT had higher PPGR on the 'bad' diet, whereas 11/14 in the dietitian-led arm had lower PPGR in the 'good' vs. 'bad' arm. Taken together, the 'good' diet led to significantly lower PPGR than the 'bad' diet. |
An algorithm that used participant-level biological data to generate PN advice did not outperform dietitian-led dietary advice in predicting the PPGR to foods. |
| Livingstone et al. (14) |
A large, web-based RCT compared PN advice to a control group receiving generic dietary guideline-based advice (L0). Within the PN groups, 3 levels were compared: PN advice based on dietary intake alone (L1) vs. L1 + phenotypic information used to generate PN advice vs. L2 + genotypic information used to generate PN advice. |
n=1,607 generally healthy individuals. |
6 months. |
Change in Mediterranean diet score. |
Significant improvement in Mediterranean diet score: control: 5.20 ± 0.05 vs. PN groups: 5.48 ± 0.07; mean difference of 0.28 (p=0.002). No significant difference between L1 vs. L2 + L3. Significant difference between L2 (5.38 ± 0.10) and L3 (5.63 ± 0.10); mean difference of 0.25 (p=0.029). |
PN advice was superior to generic advice for improving adherence to a Mediterranean-style dietary pattern. No clear differences between PN groups, with a slight benefit for L3 vs. L2 (but not vs. L1). Dietary changes were of marginal clinical relevance. |
| Celis-Morales et al. (13) |
Same trial as Livingstone et al. (14). |
Same trial as Livingstone et al. (14). |
Same trial as Livingstone et al. (14). |
Food group and nutrient intakes. |
Significant differences for PN groups vs. control: less red meat (-5.48 g/d; p=0.046), less salt (-0.65 g/d; p=0.002), less SFA (-1.14% energy; p<0.001); more folate (+29.6 µg; p=0.048), greater HEI score (+1.27; p=0.01). |
PN advice was superior to generic advice for improving some, but not all, food groups and nutrients of concern. No differences between PN groups. Dietary changes were of marginal clinical relevance and in the direction of dietary guidelines-based advice. |
| Berry et al. (16) |
Study designed to quantify and predict individual variations in PPGR and PP triglyceride and insulin responses to 8 standardised meals. |
n=1,102 healthy individuals. |
2 weeks. |
Determinants of PPGR, PP triglyceride and insulin responses to standardised meals. |
Large inter-individual variation in PP responses to meals. Various predictors of PP responses to meals. Largest individual-level predictors for PPGR: genetics (~9.5%), serum glycaemic markers (~7%). Largest for PP insulin: serum glycaemic markers (~10%), microbiome (~5%). Largest for PP lipaemia: serum lipid markers (~23%), serum glycaemic markers (~13%). Unique individual meal-specific responses only explained 7.6% of variance in PPGR. |
Variation in PP responses to glucose, insulin, and triglycerides were minimally predicted by individual-level factors. Findings differ to Zeevi et al. (15) who found the microbiome was the largest predictor of inter-individual PPGR variability. |
| Ben-Yacov et al. (17) |
Parallel RCT comparing Mediterranean diet group to group eating according to PN advice generated by the machine learning algorithm from Zeevi et al. (15). |
n=225 individuals with obesity. |
6 months (with further 6 months of follow-up). |
Time spent in hyperglycaemic state (i.e., >140 mg/dL or >7.8 mmol/L) and HbA1c. |
Both interventions reduced the daily time with glucose levels >140 mg/dL (or >7.8 mmol/L) and HbA1c. However, reductions were greater for the PN group. PN group: -1.3 hr/d and -0.16%, respectively. Mediterranean group: -0.3 hr/d and -0.08%, respectively. |
The PN group ate less than half the daily carbohydrate intake of the Mediterranean diet group (i.e., 20% vs. 42% of energy, respectively), which helps to explain the results. |
| Kharmats et al. (18) |
Parallel RCT comparing a PN group (using Zeevi et al. (15) algorithm) aimed at achieving a 500 kcal/d energy deficit to a standardised low-fat diet also aimed at achieving a 500 kcal/d energy deficit. |
n=204 individuals in high-risk (but normal) HbA1c range (mean: 5.81%). |
6 months. |
MAGE; HbA1c. |
No significant differences in MAGE or HbA1c between groups. |
This study balanced behavioural support between groups, and this may explain the lack of difference in adherence (and outcomes) observed between groups. |
| Höchsmann et al. (19) |
Parallel RCT comparing individuals prescribed a genotype-concordant diet compared to a genotype-discordant diet. Genotype-diet concordance was determined based on individuals' carbohydrate- and fat-responsive genotype patterns. |
n=145 individuals with obesity. |
12 weeks. |
Weight loss (kg). |
No significant differences in weight loss between groups. |
Similar to Kharmats et al. (18), a balanced behavioural approach (i.e., dietitian guidance) led to no significant differences in cardiometabolic health between PN groups. |
| Bermingham et al. (20) |
Parallel RCT comparing individuals prescribed a PN programme with individuals given dietary guideline-based advice. The PN programme prescribed dietary plans based on the algorithm from Berry et al. (16). |
n=347 individuals generally representative of US population. |
18 weeks. |
Triglycerides, LDL-C, other cardiometabolic health markers |
PN group had improvements in triglycerides (-0.13 mmol/L; p=0.016), body weight (-2.46 kg), waist circumference (-2.35 cm), HbA1c (-0.05%), diet quality (+7.08 on HEI), and microbiome (beta-diversity) outcomes. No significant difference between groups for LDL-C, hip circumference, blood pressure, insulin, glucose, C-peptide, apolipoprotein A1, apolipoprotein B, and postprandial triglycerides. |
The PN group had modest improvements in cardiometabolic health markers compared to a generic dietary guideline-based advice group. However, the PN group also received more support, education, and contact with researchers. |
| Abbreviations: HbA1c: glycated haemoglobin; HEI: Healthy Eating Index; LDL-C: low-density lipoprotein cholesterol; MAGE: mean amplitude of glycaemic excursions; PN: personalised nutrition; PPGR: postprandial glucose responses; RCT: randomised controlled trial. References are listed in order of publication month/year. |
Incorporating the Behavioural Context into Personalised Nutrition
As discussed, the field of PN has centred differences in biological traits [e.g., phenotypic, genotypic] as the basis for personalised dietary advice
beyond personalisation based on dietary intake alone (10, 22), the latter of which being typical of standard dietetic practice (23, 24). However, personalisation of how the individual is supported to engage in dietary behaviour change is not commonplace. Treating individuals as a monolith with regards to what is likely to change their behaviour showcases a lack of understanding of human behaviour, and it may help to explain underwhelming results in PN research [
Table 1].
Previous PN trials, such as Food4Me (13, 25), have delivered PN advice in a uniform fashion to all participants using a pre-selected list of behavioural change techniques [BCTs]—whether implicitly or explicitly. This approach treats all individuals as identical regarding what components of behaviour are likely to change behaviour if targeted, and in Food4Me, most BCTs focused on information provision, knowledge improvement, and self-monitoring strategies (25). While this behavioural strategy may be appropriate for those lacking psychological capability, it would be inappropriate for those lacking, e.g., the necessary monetary resources [i.e., physical opportunity] or [reflective or automatic] motivation to eat healthier.
This may explain why those that benefitted most from the PN advice had greater initial levels of self-efficacy, health consciousness, and motivation to improve their health [i.e., they had more motivation, indicating they were better positioned to engage with the PN advice and make the recommended dietary changes] (26). Indeed, in another study, Dijksterhuis et al. (27) reported that individual differences in psychosocial characteristics predict differing preferences as to the types of dietary advice individuals wish to receive, and a very recent study from Briazu et al. (28) reported greater dietary improvements for individuals given personalised dietary advice based on socio-demographic group, cognitive characteristics, and sensory preferences compared to generic advice.
An alternative approach would be to personalise the intervention based on an individual’s behavioural context. If, for example, an individual lacks knowledge of how to eat a healthier diet, then providing knowledge in the delivery of the PN advice would be appropriate. However, if an individual has the requisite knowledge but lacks the material resources to eat a healthier diet, it would be inappropriate to assume that knowledge provision would help them to eat in this manner. The Behaviour Change Wheel [
Figure 3], formulated by leading behavioural scientists, offers a methodology to designing interventions that are theoretically underpinned by a comprehensive theory of behaviour change [i.e., the COM-B model] (5, 29).
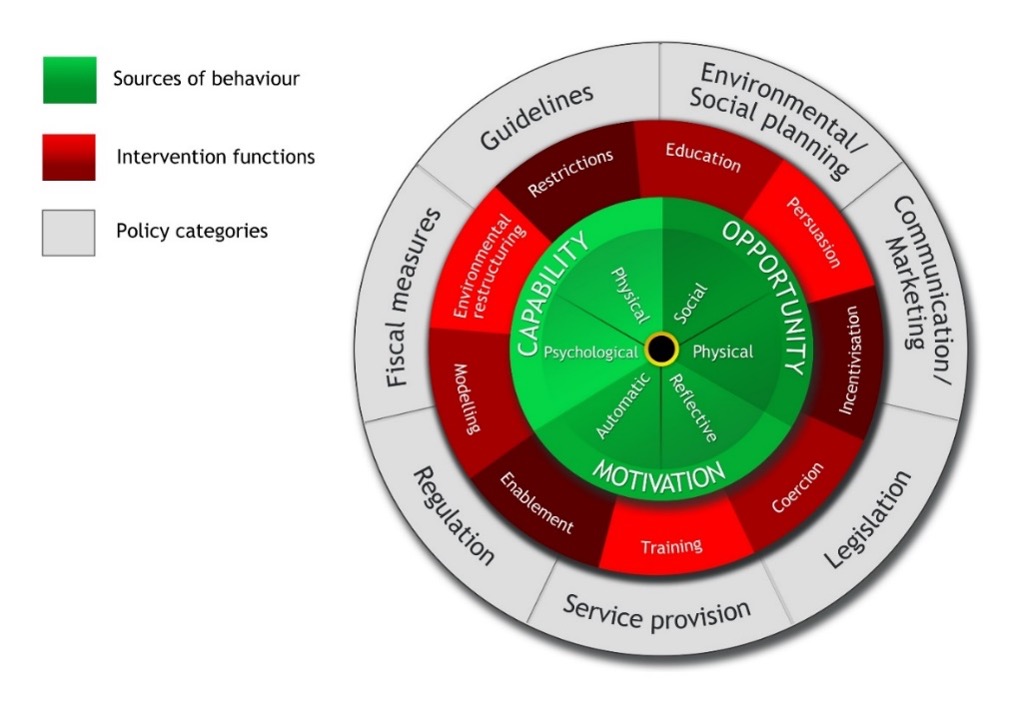
Figure 3. The Behaviour Change Wheel (5). This is a framework for behaviour intervention development developed to address the limitations of 19 previously identified frameworks for intervention development. It holds the COM-B model at its core.
This model, with its step-by-step accompanying guide [
Figure 4], has been shown to produce interventions that are more effective than interventions created without its use for pro-environmental behaviours (30), and it has also been retrospectively applied to identify why certain health-related interventions may have failed, i.e., by identifying that the interventions did not target the components of behaviour necessary to change behaviour. Guided by this approach, PN interventions can be tailored to an individual’s behavioural context.
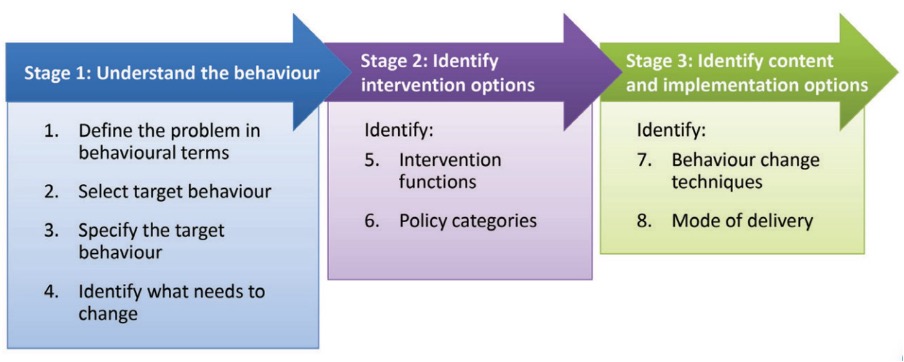
Figure 4. The Behaviour Change Wheel Guide (29). A helpful example of how to apply this approach to the development of behaviour change interventions in nutrition research is discussed by Atkins and Michie (31).
Behavioural Personalisation in Personalised Nutrition: The Path Forward
My PhD is primarily concerned with developing novel PN decision tree algorithms to support sustainable and healthy eating, as part of a broader scope of work within our
University College Dublin (UCD) PLAN’EAT Living Lab (32). The research question I seek to address is whether personalising behavioural support to an individual’s behavioural context will help them to better adhere to PN recommendations relative to not doing so. Owing to the novelty of this research approach, there are a multitude of possible directions the field can take to progress.
The first, most logical step, would be to compare a standard PN approach, such as what is typical in dietetic practice (the PN approach used in Food4Me (13, 14), with a PN approach that additionally personalises behavioural support to an individual’s behavioural context [
Figure 5]. Such an approach reflects a pragmatic trial design, that asks the question: "
does offering additional personalised behavioural support improve adherence to personalised dietary recommendations (relative to a standard PN approach)?". Of course, there is an element of personalised behavioural support incorporated into typical dietetic practice [e.g., goal setting, action planning, etc.], as is implicit in dietetic practice guidelines and is evident in published dietetic interventions (23, 24).
However, the provision of personalised behavioural support that is developed based on a behavioural diagnosis of an individual’s barriers to improving their dietary behaviours—that itself is determined through the use of a comprehensive framework and model of human behaviour – e.g., the Behaviour Change Wheel and COM-B model, respectively] (5, 29) — is lacking in dietetic practice, which typically uses a narrow range of behaviour change theories to guide the administration of behavioural support (25). And this is likewise lacking in previous PN studies [
Table 1] which, as already mentioned, have focused on the development of personalised dietary advice, not personalised behavioural support to adhere to the generated personalised dietary advice.
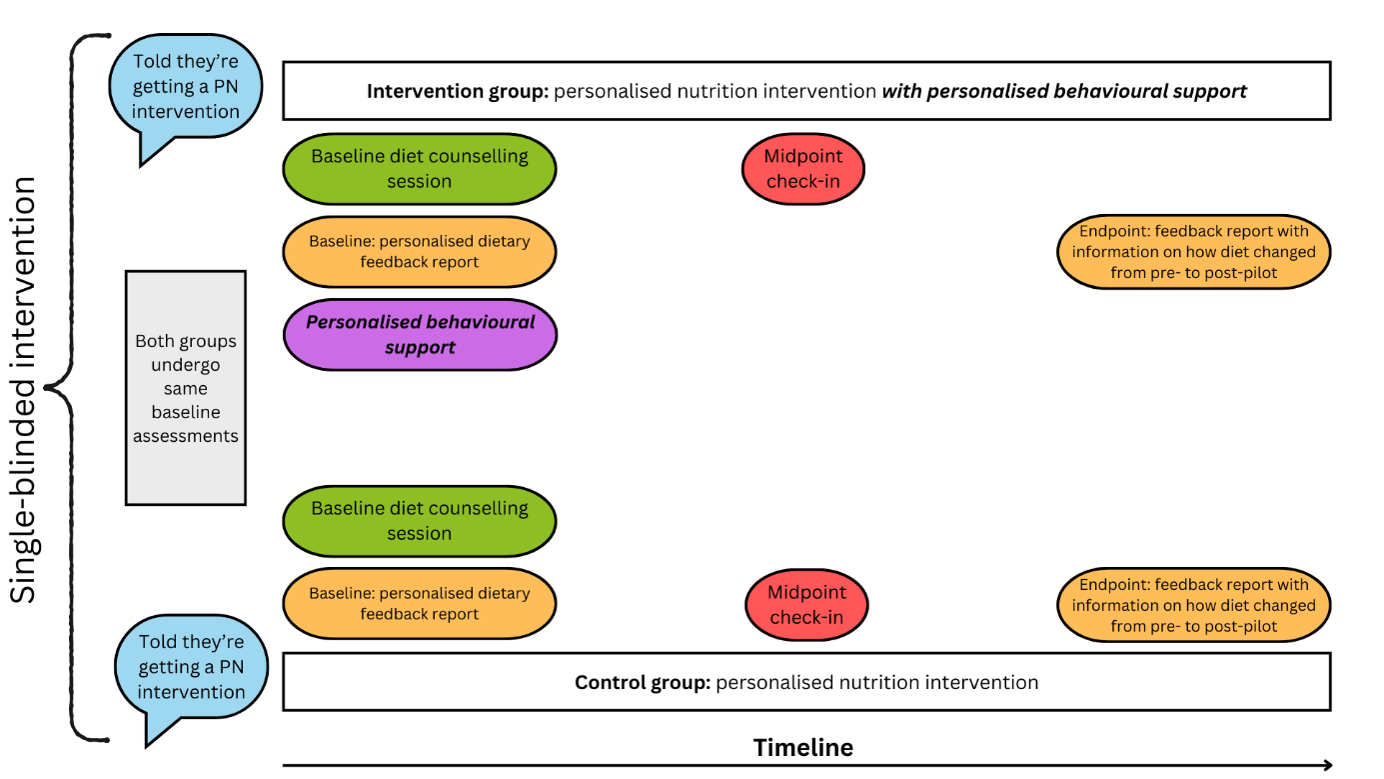
Figure 5. A hypothetical PN trial that compares a standard PN intervention (similar to dietetic counselling/the approach of Food4Me (13)) to a PN intervention that also provides personalised behavioural support (ideally based on an understanding of an individual’s behavioural context). Intervention components between the intervention and control group are balanced except for the addition of personalised behavioural support in the intervention group (i.e., the purple oval). Figure style adapted from Nicola Guess’s blog.
One possible critique of the proposed study design in
Figure 5 could be that the additional provision of personalised dietary advice may work to improve dietary behaviours by simply providing more [vs. less] support relative to the control group, not necessarily in virtue of the advice being personalised. Thus, this study design does not necessarily test the hypothesis that the personalised aspect of the behavioural support
independently improves dietary behaviours compared to, say, generic or perhaps deliberately non-personalised behavioural support. This is a fair critique; however, because most PN research has yet to personalise behavioural support, it is important to first determine whether additionally doing so is more effective than a standard PN approach before isolating whether additional behavioural support, be it personalised or not, independently improves dietary behaviours. Considering the often lacklustre results of previous PN interventions [see
Table 1], including an intervention that provided much more generic behavioural support to the intervention compared to control group (20), it is conceivable that personalised behavioural support would lead to improvements in dietary behaviour beyond what would be expected by the inclusion of an equivalent amount of generic behavioural support that does not account for an individual’s behavioural context. This is especially the case if the personalised behavioural support is underpinned by a comprehensive theory of behaviour, i.e., the COM-B model (5).
Next Steps in my PhD Research
I am currently in the final stages of developing a short-term feasibility pilot study that looks a whole lot like
Figure 5. This study will be conducted with young, healthy university students within the
UCD PLAN’EAT Living Lab (32), and will help to inform the development of a larger trial. While the focus of our trial (and wider project) is to improve adherence to sustainable and healthy diets [SHDs] (32), the approach of personalising behavioural support to help individuals adhere to dietary advice can be applied to a range of dietary behavioural goals. Because our PN decision tree algorithms, which will automate personalised dietary advice and behavioural support to individuals, must be made in advance of the pilot study commencing, a select number of behavioural barriers to eating SHDs had to be identified in advance so that personalised behavioural interventions could be likewise created in advance.
To do so, we triangulated evidence [as is recommended (29)] on the factors influencing SHD consumption through a review of the wider literature (33), as well as quantitative and qualitative data collection with our population [i.e., young, healthy university students in UCD] on what influences their dietary behaviours. With this information, we pre-selected several important barriers to eating more or less of certain food groups [e.g., legumes, meat] and are currently developing interventions to address these barriers. In this way, the personalised behavioural support an individual will receive through our study is not truly personalised; rather, it is personalised at a subgroup level, which as an approach is still often considered under the PN umbrella and is sometimes termed a targeted or precision approach [e.g., "metabotyping"] (34, 35). While a targeted approach like this does not have the capacity to deliver truly bespoke personalised behavioural solutions on an individual basis, the decision tree algorithms that permit the delivery of this approach allow for the scaling of interventions, particularly through digital media applications, which is the ultimate plan for our work.
Concluding Thoughts
What I hope I have made clear throughout this article is that PN, and possibly nutrition science more generally, should shift focus and incorporate key learnings from behavioural science into the development of interventions that seek to change dietary behaviours. Through doing so, the field can progress and learn what types of interventions, and components of interventions, may improve specific dietary behaviours, and in what context, in what manner, compared with what, for whom, in what settings, and why, etc. (36).
While I have outlined how our research group intends to wade into these behavioural waters, incorporating further insights from the behavioural sciences into PN and other dietary behavioural interventions could help to develop a more coherent evidence base on how to change dietary behaviour, which could have upstream policy implications in time. Some such insights include an explicit focus on testing MOA that may mediate behaviour change [and at which timepoints] (37, 38); increasing the frequency of behavioural assessments (39); incorporating individual-level statistical inference [instead of only group-level statistical inference] (39); shifting from static to continuous tuning interventions (39); and annotating all behavioural intervention components that are included in a dietary behavioural intervention [e.g., BCTs, MOA, setting, style of delivery, etc.] to enhance evidence synthesis and allow for the identification of behavioural intervention components that may work, or not, in what context(s) (36).
Relevant to the final point, the recent development of the Behaviour Change Intervention Ontology as part of the Human Behaviour Change Project provides a shared language for annotating behavioural intervention components (40). Specific sub-ontologies that have been characterised so far within this ontology range from the Human Behaviour Ontology (41), to those concerned with behaviour change content [i.e., the BCTs used (42)], to the delivery of the intervention [i.e., style of delivery (43), mode of delivery (44), source of delivery (45)], to the behaviour change intervention scenario [e.g., setting (46)], and finally to the MOA engaged within the behaviour change intervention (47).
In addition, sub-ontologies for the dose of BCTs used, the schedule of delivery, the target population, intervention engagement [i.e., the degree to which participants take part in an intervention], and intervention fidelity [i.e., the degree to which an intervention is implemented as planned] are being developed in this project (36, 42). Finally, using non-traditional study designs [e.g.,
n-of-1 trials] may be necessary to develop PN interventions that are truly personalised to an individual’s dietary and behavioural needs, and that can be sensitive to temporal changes in these needs (48).
To conclude, I propose that shifting the focus from biology to behaviour in the era of big data and personalisation holds promise in the pursuit of effective PN interventions. The results from my PhD research will help to validate or falsify this proposition.


